
Review and capture Import and Export Address Tables from Memory
Review and capture Import and Export Address Tables from Memory https://www.windowsscope.com/wp-content/uploads/2016/07/iatblog1-1024x785.jpg 1024 785 WindowsSCOPE https://www.windowsscope.com/wp-content/uploads/2016/07/iatblog1-1024x785.jpgWhat is a DLL: A DLL (Dynamic-Link Library) can be thought of as a library of code and data that can be used by many programs at once. Essentially, it contains functions that can be called by portable executables. Utilizing a DLL has many advantages. It saves the programmer time from having to write code to perform basic interactions with the operating system. This also reduces the size of programs because they do not need to contain the code from the DLL. A DLL can be used by many processes at once which saves memory by only needing one copy loaded in memory. Using a DLL makes the program modular, which allows for easy updating. Only the DLL needs to be updated rather than the entire program.
What is an import and export address table: When a program is loaded in Windows, the operating system scans the Import Address Table for functions to import from DLL’s. The memory addresses for these functions change because the operating system cannot guarantee a DLL will be loaded at a specific memory address, so rather than having to re-compile the new addresses at run-time, import and export address tables were created. Typically, executable programs (.exe’s) only have import address tables because they import functions from DLL’s and don’t export any functions. a DLL on the other hand may have both because it can borrow functions from other DLL’s in addition to exporting its own functions for use. For an entry in an import address table of a program, there should be a matching entry in the export addess table of the DLL that exports the function.
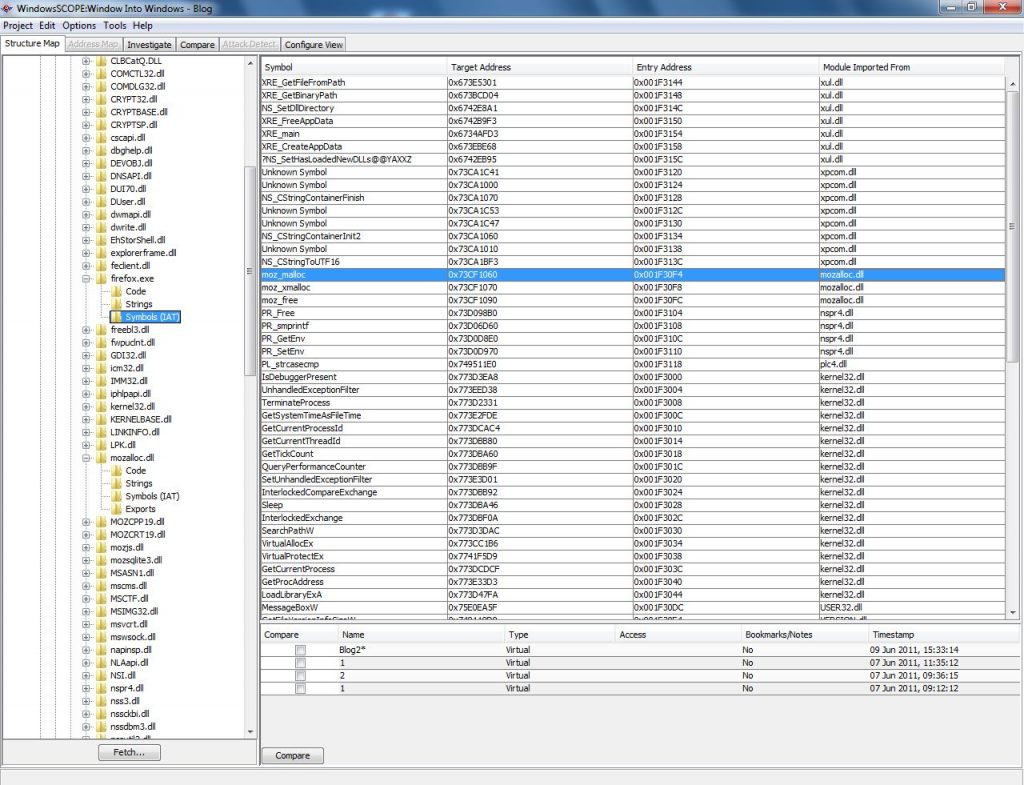
To see imports and exports in WindowSCOPE: Select a project and then snapshot that you would like to use. In the left panel of the screen, expand the tree ‘Memory View’. In ‘Memory View’ there should be a ‘Processes’ and ‘Drivers’ tree. Select a process or driver to analyze. If a process is selected, expand the ‘Modules’ tree for the process and then select a module to look at. If a driver was selected then just expand the tree for the driver. The ‘Symbols (IAT)’ folder lists the Import Address Table that the portable executable is using and the ‘Exports’ folder lists the Export Address Table that the DLL is providing. The Import Address Table should list the ‘Symbol Name’, ‘Target Address’, ‘Entry Address’, and ‘Module Imported From’. The ‘Symbol Name’ is the name of the function, the ‘Target Address’ is the memory address where the function can be found, the ‘Entry Address’ is the memory address of the entry in the Import Address Table, and the ‘Module Imported From’ shows which portable executable the function resides in.

In this example, the ‘Symbol Name’ moz_malloc is imported from the module ‘mozalloc.dll’ with the ‘Target Address’ 0x73CF1060 and ‘Entry Address’ 0x001F30F4. This means that in the ‘Exports’ folder of mozalloc.dll there will be an entry for moz_malloc because it is exporting the function.

Notice that the Target Address and Export Addresses from moz_malloc match up correctly. Entries can quickly be found using the Find tool (Ctrl+F)
Using the Graph tool: The Graph tool can be used to get an idea of the instruction flow for the program, which is useful for understanding how the program works. Select ‘Code’ folder and then on the top tab menu select ‘Investigate’. On the tab menu right below, select ‘Disassembled’. Find the ‘Virtual Address’ that matches with the ‘Target Address’ found earlier. Once found, right-click the entry and select ‘Graph from here:Workpad’.

This will generate the graph using this instruction as an entry point. The Workpad is useful for graphing large portable executables where only portions of the data needs to be looked at. Alternatively, the tab ‘Graph’ can be clicked to skip this process and display the entire graph. Graphing can take a variable amount of time depending on how much data is being graphed. For the example, ‘mozallo.dll’ was graphed and looked at. The function moz_malloc was found by searching the list of functions on the left panel. Double-clicking on a function will highlight the function on the graph. It will also bring up a panel on the right that shows a graph of the function involving relevant code and procedures called. The procedures called by the function can be seen on the graph as well, and any procedure can be double-clicked on to be further examined.

In conclusion: WindowsSCOPE can be used to directly view the import and export address tables of any process or driver memory. Import and export address tables are important because they keep track of the memory addresses of functions that are being shared. Virtually every program takes advantage of calling functions from DLL’s making import and export address tables an integral part of Windows. The graphing tool can be used to easily see the transitions between a process or driver and the DLL’s that they use.